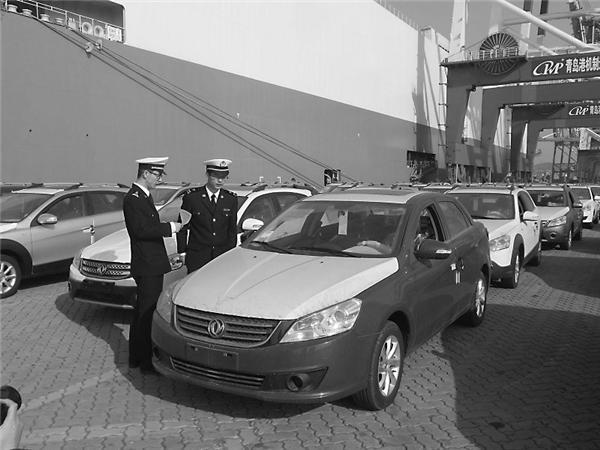
K line graph: Chinese car exports raised for four consecutive months

According to China Automotive Industry Association, production and sales volumes of cars continued to increase in November and hit a new high, with both month-on-month and year-on-year growth surpassed 10%.
In November, the production and sales volumes of cars were 3,011 thousand and 2,939 thousand units respectively, a 16.4% and a 10.9% increase over October, while a 17.8% and a 16.6% growth compared with the same period of last year. During Jan to Nov this year, the production and sales volumes of cars reached 25.03 million and 24.95 million respectively, a 14.3% and a 14.1% increase compared with 12.5% and 10.8% during the same period of last year.
In the aspect of export, car export of November reached 74 thousand, a 19.6% month-on-month growth and a 34.6% year-on-year increase, and a growth consecutively for the fourth months.
In the aspect of types of cars, passenger cars had 55 thousand units exported in November, a 25.1% increase over October and a 55.5% increase over the same period of last year. While commercial cars had 19 thousand units exported in November, a 6.5% month-on-month increase and a 2.6% decrease year over year.
In the past 11 months, export of vehicles was 629 thousand units, a narrowing decline of 5.1% over the same period of last year, among which the export of passenger cars rose 6.9% year on year to 419 thousand unit, and that of the commercial cars declined 22.4% year on year to 210 thousand units.
This year, export of self-owned vehicles improved markedly. In the first three quarters, SUVs exported to Asia accounted for 44.35%, the biggest portion of the world’s car exports; share of the SUVs export to Europe had a remarkable year-on-year increase to 16.95% and ranked NO.2; while exports to Africa, Latin America and North America were both over 10%; car export to Oceania was less than one thousand, and its share accounted for no more than 1%.
As for different countries, SUV exports to Iran, Russia, Egypt and America ranked the top 4 domestically, with two-digital shares of 38%, 12.96%, 11.19% and 10.95% respectively; shares of SUV exports to Chile, the Republic of Belarus, Saudi Arabia and Peru were between 2%-10%, while that to Columbia and Argentina were between 1% to 2%. SUV Exports to the top 10 countries accounted for almost 90% of the total SUV export volume.

