
Sales plunges make market chilling
Shanghai (ZXZC)- Data of the CPCA shows that sales of China's passenger vehicles (excl. minivans) plunged by 5.7% year on year (YoY) to 1.57 mn units (shown in Chart 1), and slid down 14.66% month-on-month(MoM) from 1.83 mn units in June. PV sales posted a YoY growth of 4.2% up to 13.12 mn units in YTD terms, but a continuous cool-down from Q1 2018. A poor sales performance definitely resulted in a weak production output. The figure of PV production (excl. minivans) in this July hit at 1.69 mn units with a surprising YoY decline of 3.7%. As we warned in last month, the market is being unable to against pressures from consumer recession, trade tensions with the U.S. and extreme high inventory.
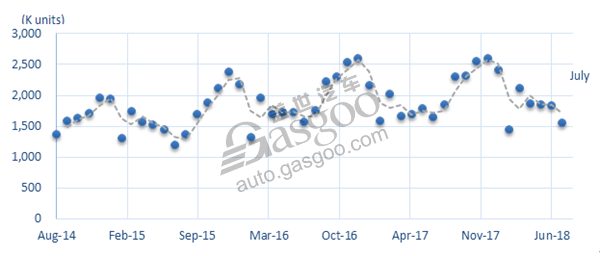
Chart 1: Monthly China PV Sales from CPCA
In retail sector, the sales of July 2018 kept low profile and reached 1.66 mn units. Although the retail sales suffered a drop of 4.77% YoY, it was still satisfactory because it exceeded wholesale of this July. The bounce of retail activity was also reflected in the decline of inventory index, which was improved to 1.79 months from 1.91 months (shown as Chart 3) in June. It seems that unfavorable gap between wholesale and retail is turning to be rebalanced, but the year-to-date inventory (wholesale – retail) reached up to 1.4 mn units and annual one is expected to maintain around 1.5 mn units, much higher than last two years. The stubbornly high inventory has been a common failing for most automakers this year. Dealers of some particular brands have to protest against high inventory under a chilling market climate.
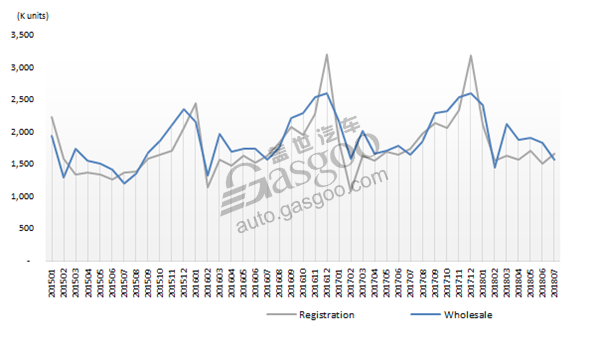
Chart 2: PV Inventory
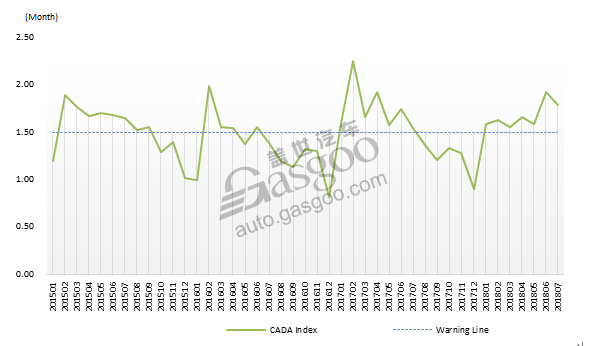
Chart 3: Inventory Index by CADA
Weak demand resulted in negative year-over-year growth over car, MPV,and SUV segments. In July, sales of car segment had a slight YoY decline hitting at 818,785 units, but, fortunately, the year-to-date growth rate kept around 4.6%. SUV suffered sales drop again after this June with 641K units delivered in July, which declined by 8.2% compared with July 2017. The hard landing also slowed the annual growth rate from June's 10.2% to July's 7.8%. However, SUV is still the strategic focus of many OEMs, especially the international carmakers. ZXZC thinks that these carmakers will still carry out their plan of product expansion mainly relying on SUV launches sales plunge of MPV has been a normality. Unsurprisingly YoY change was –21.7% and YTD change was -14.3%. Two-child policy and aged tendency of population didn't release huge demands on MPV products. The renovation of MPV products is in process, and will be the key point that leads the segment return to uptrend channel. Minivan enjoyed a big rise in sales volume in July, but it still could not rescue the big failure in a wide view (YTD growth was -23.2%). China's plug-in electric cars kept strong momentum. Monthly sales hit at 74.9K units incluing 51.6K all-electric vehicles and 23.3 plug-in hybrids, which offered YoY increases of 60.6% and 142.7% respectively.
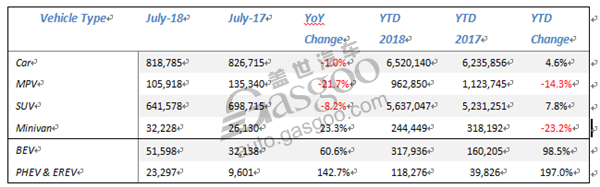
Table 1: PV & NEV Sales by Vehicle Types
Fuel consumption is changing the structure of passenger vehicles
As mentioned above, the market of this year is affected by many factors like weak consumption, economy and international relations, etc. In addition, the market structure occurred weird changes that MPV is losing grounds and SUV is flaming out. The impact by fuel economy is being a popular topic in China auto industry as well as in global market. Since the industy entered into 4th phase of fuel consumption limit, passenger car makers have struggled to lower their CAFC (Corporate Average Fuel Consumption) accroding to related regulations. Furthermore, as we know, China's government set rigorous ‘Dual-Credit System’ requiring high thresholds for production of plug-in EVs (PEVs), and took into effect from this April. On the one hand, most OEMs are not only facing an increasingly tight deadline in terms of PEVs’ roll-out, but also being given lower and lower fuel consumption limits.
Most companies have troubles in meeting short-term (2018-2019) rigid targets with no or poor EV sales. A feasible solution for the difficulty is to use structure adjustment of good emission compliance as the leverage to control the results.
In current CAFC regulation, a single model has a particular emission target according to its curb mass (GB27999-2014). On account of this rule, we calculated FC (fuel economy) satisfaction rate of on-sale domestic passenger vehicles, and found that cCar is closer to the target line than SUV and MPV whose average satisfaction rates are 83.67%, 77.19%, and 74.16% respectively. The findings can give one of the reasons that why the output of Car turned upward from 2nd quarter. Chart 4-6 shows the detail FCSR landscapes of Car, SUV,and MPV (excl. BEV models). The advantages of cars can be summarized by main points, lighter curb masses and more penertration of electrification, which have also been two cogent trends of the industry.
The MIIT (Ministry of Industry and Information Technology of the People's Republic China) announced the final results of 2017 CAFC in this April. 37 manufacturers of domestic production and 16 international manufacturers of import failed in fuel consumption assessment. Thanks to pressures from more rigious CAFC targets and ‘Dual-Credit System’, more OEMs are facing risks of failure in regulations or penalty in coming two years. Any feasible and manipulative methods will be used by OEMs to couple with mandatory requirements.
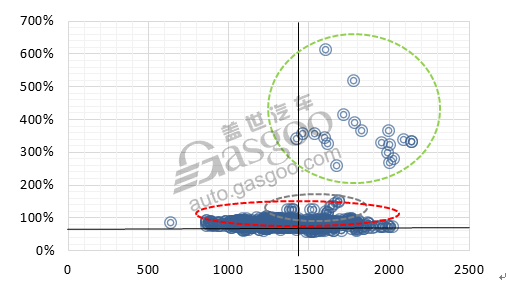
Chart 4 Fuel consumption satisfaction rate of SUV - w/o BEV
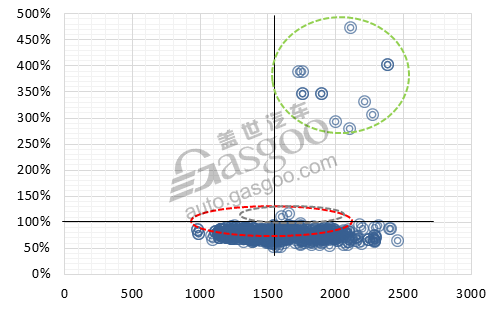
Chart 5 Fuel consumption satisfaction rate of Car – w/o BEV
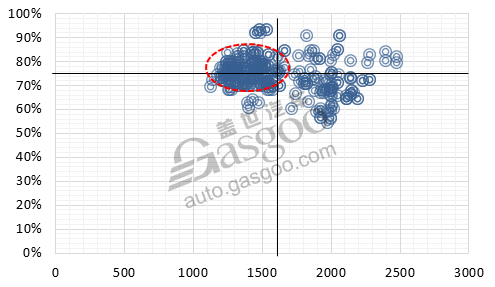
Chart 6: Fuel consumption satisfaction rate of MPV - w/o BEV
Note (Chart 4 - 6):
horizontal axis – Curb mass
Vertical axis – Satisfaction rate (Target fuel consumption/actual fuel consumption)
Red circle – High density of model distribution
Green circle – PHEV/EREV
Grey circle – HEV